Build photography
From factory floor to desert site.
Indicative imagery from the TPC delivery library. Site-specific photography is held under the engagement NDA and shared with qualified counterparties on request.
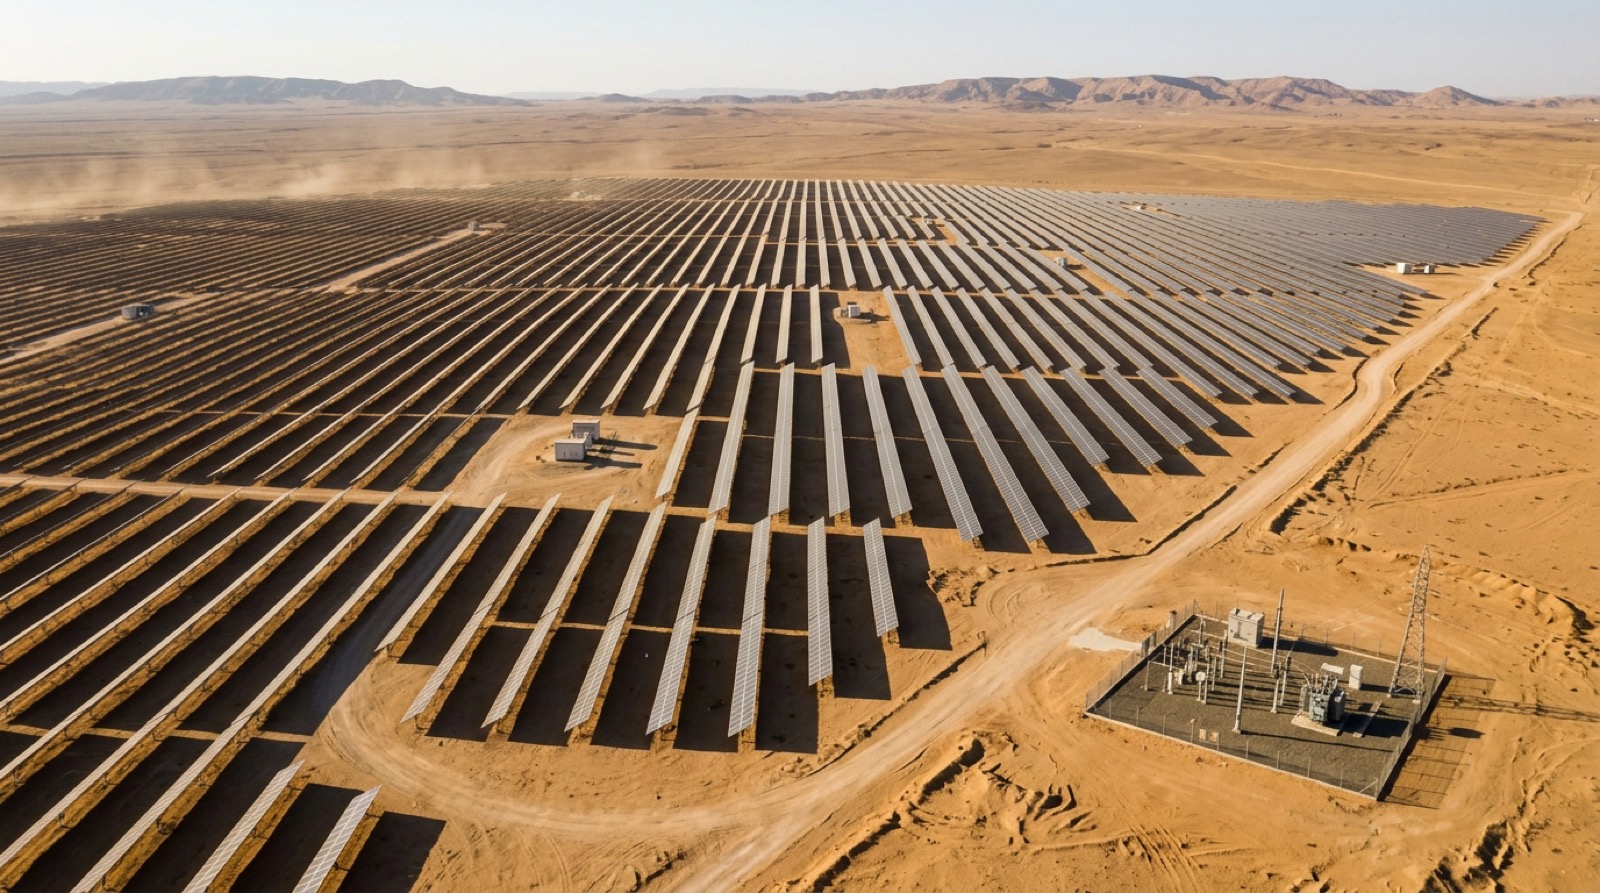
A bifacial ground-mount IPP in Anbar Province delivers 51 GWh/yr modelled Year-1 generation under a 22-year PPA — engineered through 47 °C summer ambient, validated against a measured albedo, and over-delivering by +6.8% on the SAM baseline.
Anbar's solar resource is exceptional — 2,200 kWh/m²/yr GHI at 33°N, peaking above 8 kWh/m²/day in July. That is the easy part of the brief. The hard part is everything that gets in the way of capturing it: 47 °C ambient summer peaks that drive temperature de-rating to the inverter clipping point, dust storms that re-soil the array within hours, and a 1.4 g/m²/day average soiling rate across the dry season.
The IPP commercial structure compounded the engineering brief: a single substation interconnection slot booked in a 32-month delivery window, USD-indexed PPA tariff with a 22-year term, and lender sensitivity to the P50–P90 generation gap of less than 8%. Underbuild against the substation slot meant stranded capacity for 22 years; overbuild meant clipping a high-tariff curtailment loss.
The asset was scoped to the substation, not the field. That choice cascaded into every downstream design decision — module choice, tracker-vs-fixed, string-vs-central — each evaluated against a single criterion: what gets the most energy through that 22 MW interconnection over 22 years?
A 25 MWp DC array against a 22 MW AC export gives a 1.14 oversize ratio — modest by tropical-utility standards (1.20–1.35) but deliberate. Anbar's near-vertical irradiance profile means clipping losses scale fast above 1.15 oversize at this latitude. The energy yield curve was solved per-decision against the 22 MW AC ceiling, not the 25 MWp DC nameplate.
Three engineering decisions diverge from a typical 25 MWp utility template:
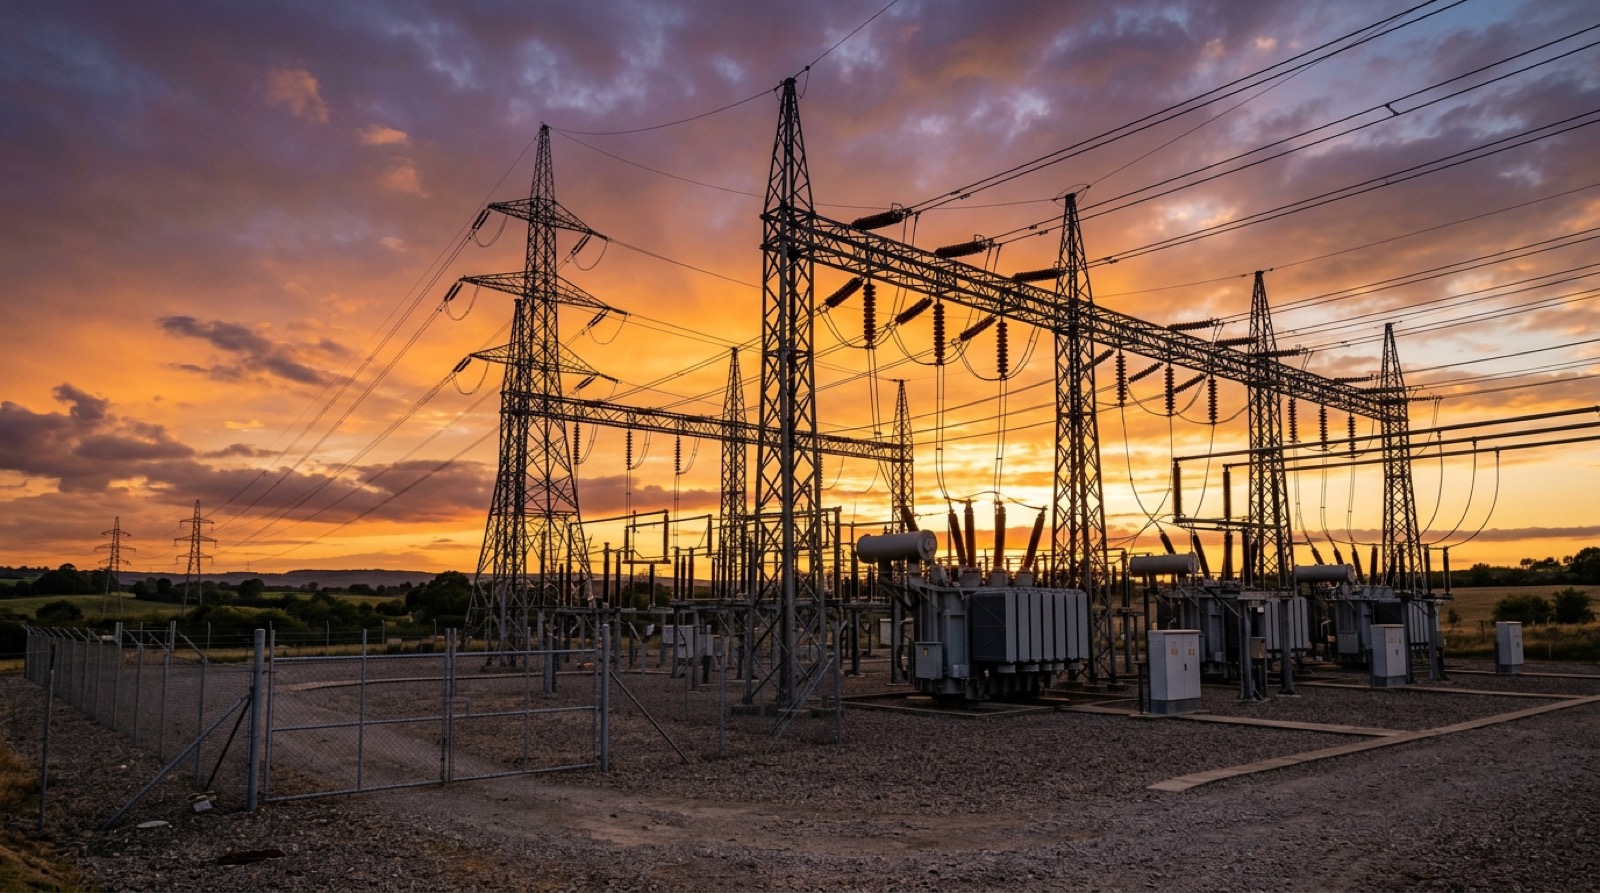
Five 5-MWp blocks feed pad-mounted MVPS skids on a 33 kV collector ring, terminating at a 25 MVA grid step-up substation and the 132 kV utility tie. The collector ring topology gives single-fault recoverability — any one MVPS can be isolated without dropping the rest of the plant.
Component selection is illustrative — final BoM in any binding TPC delivery is calibrated to grid-code, lender bankability list, and utility interconnection conditions current at financial close. Primary equipment ships factory-direct; site civils and HV scope are procured locally under TPC engineering supervision.
| Component | Specification | Qty | Source |
|---|---|---|---|
| PV module | N-Type TOPCon bifacial double-glass · 580 W · 144-cell · IEC 61215 / 61730 / 62804 (PID) | 43,103 | Factory-direct |
| Mounting structure | Hot-dip galvanised steel, fixed-tilt 25°, 1.0 m chord clearance, IEC 61400 wind-load certified to 160 km/h | 2,400 sets | Factory-direct |
| Driven pile foundation | C-section galvanised, 3.5 m, geotech-tested embedment for compacted desert soil | 9,600 | Site-procured |
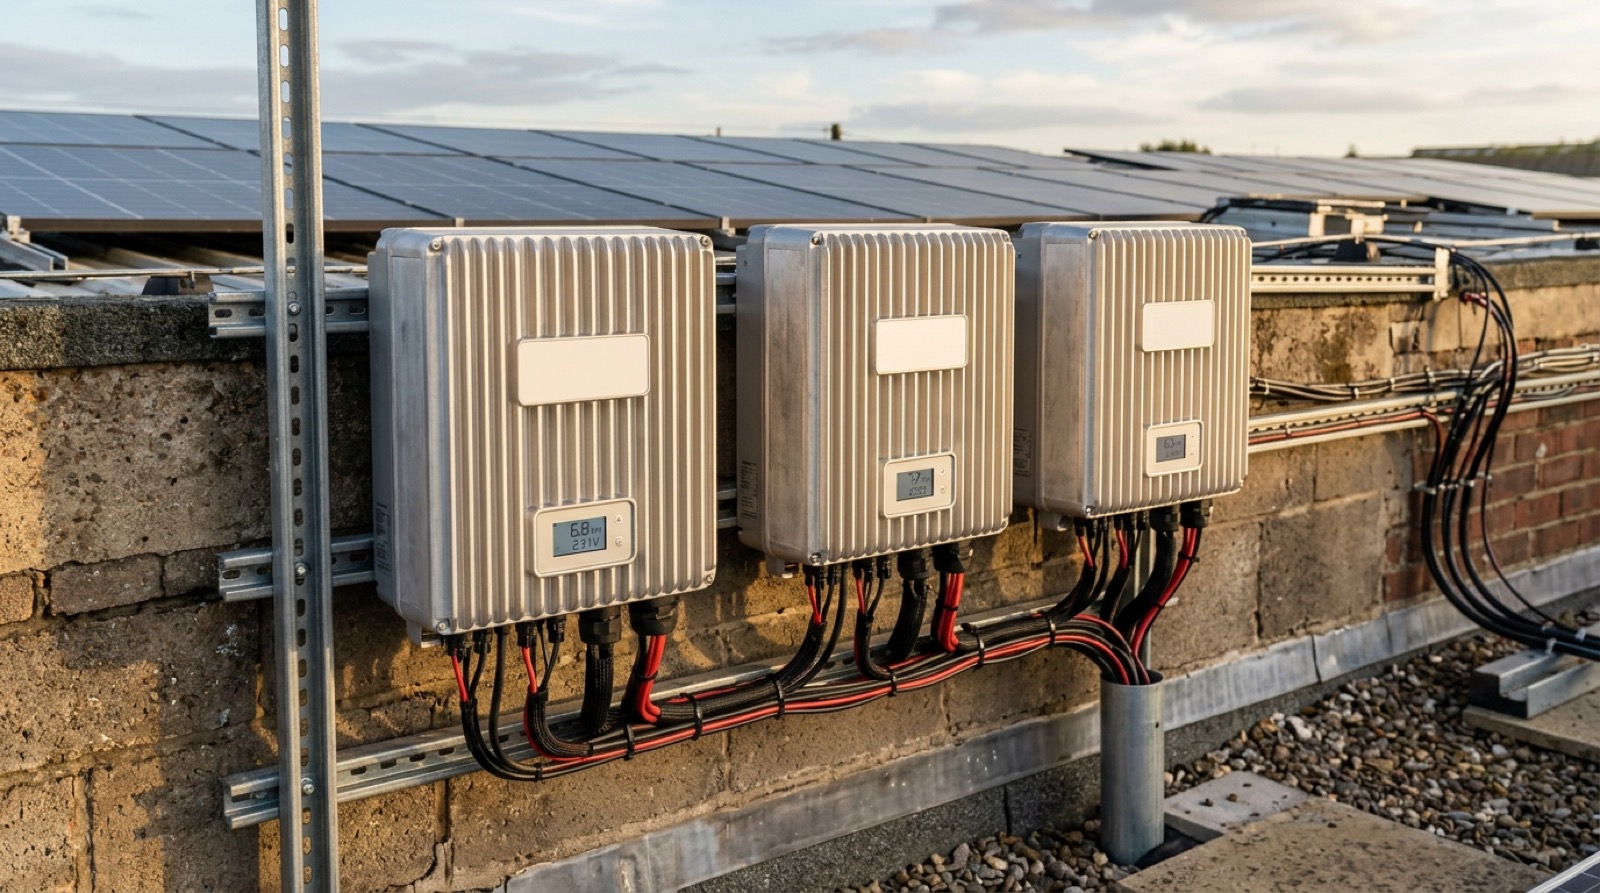
| String inverter | 1500 V DC · 250 kW · IEC 62109 · IEC 61727 · IP66 · −25 to +60 °C | 88 | Factory-direct |
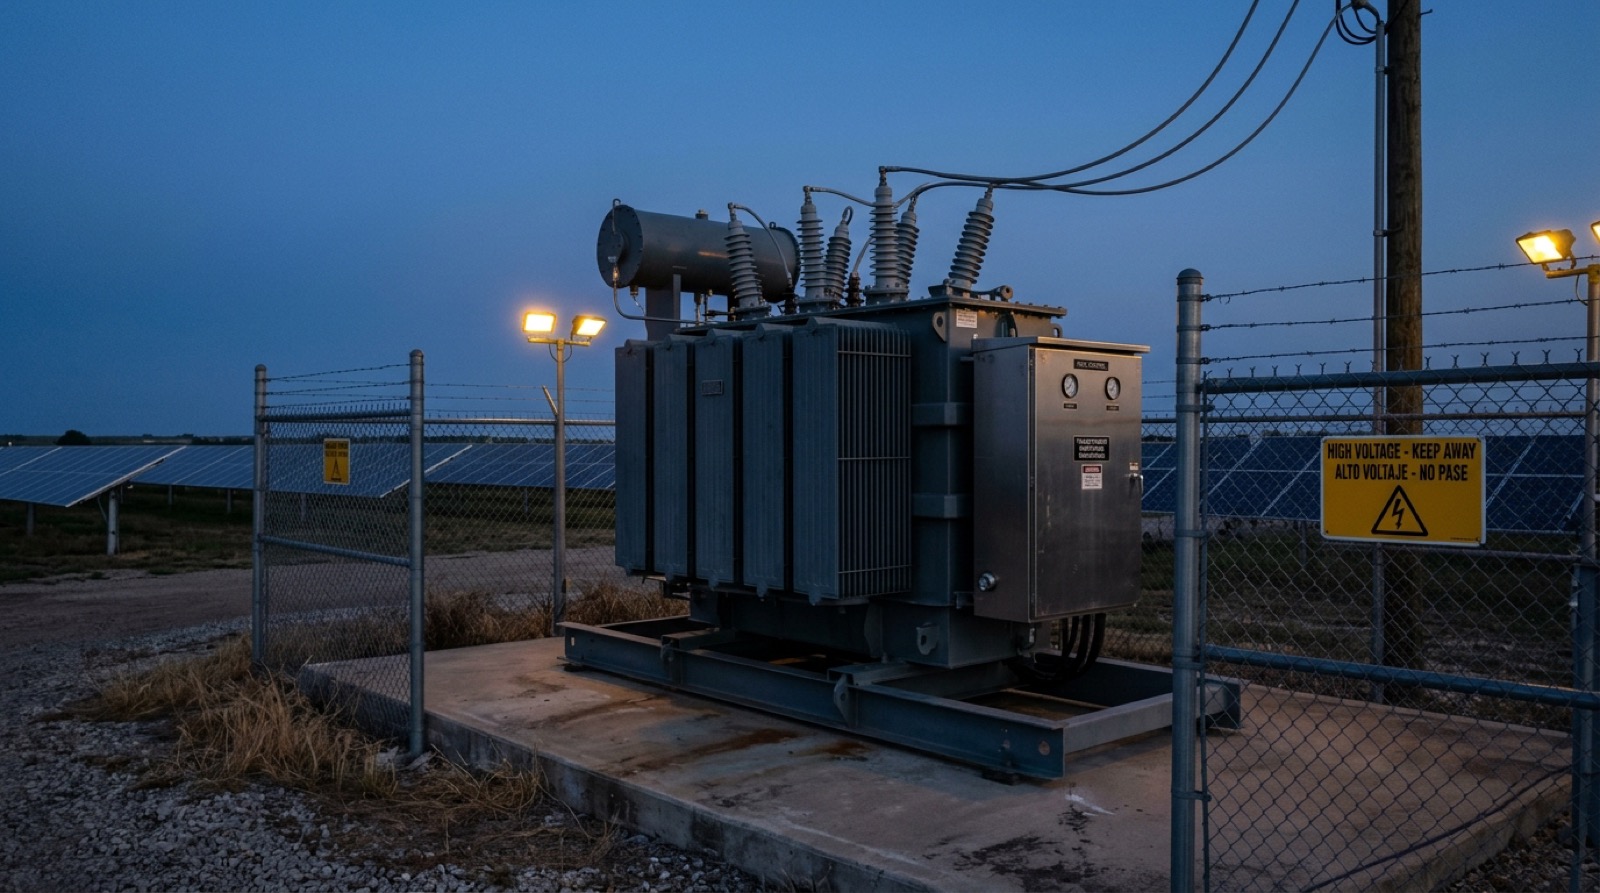
| MVPS skid (modular MV station) | Pre-fab skid: 8 × string inverter mount, 5 MVA dry-type 33 kV pad-mount transformer, MV switchgear, auxiliary AC/DC | 5 | Factory-direct |
| 33 kV ring main unit (RMU) | SF6-free vacuum-break · IEC 62271-200 · 24 / 36 kV · 630 A bus | 7 | Factory-direct |
| Step-up substation | 25 MVA ONAN 33/132 kV · GIS switchgear · IEC 60076 / 62271 · grid-code reactive power | 1 | Factory-direct |
| Plant controller / SCADA | IEC 61850 · grid-code Q at night, P/F droop, weather station integration, lender-grade reporting | 1 | Factory-direct |
| Robotic dry cleaning | Autonomous dry-brush units, solar-charged, one per array row, nightly cycle, IoT telemetry | 320 | Factory-direct |
| DC combiner / SPDs | 1500 V Type II surge arresters, fused string combiners | 704 | Factory-direct |
| HV / MV cabling | 33 kV XLPE armoured collector cable; 1500 V DC PV string cable; LV armoured AS/NZS 1429 / IEC 60502 | ~52 km | Site-procured |
| Civil & security | Bulk earthworks, perimeter fence with thermal CCTV, gravel access road, control building, 25 MVA pad | 1 lot | Site-procured |
| Lender's engineer scope | Independent technical due diligence — design review, P50/P90 yield, EPC contract review, PR test plan | 1 package | Owner-engaged |
| Commissioning & performance test | Factory acceptance + site acceptance + grid-code witness test + 7-day capacity test + IEC 61724 PR test | 1 package | TPC engineering |
Monthly generation is computed from public NASA POWER irradiance for 33°N Anbar Province, applied to the as-designed array spec at PR 0.78 with a measured-albedo bifacial gain of 1.07. Hover any bar for the underlying figure.
Summer plateau (Jun–Aug) sits at ~5.3–5.4 GWh/month, brushing AC clipping for ~2.4% of annual energy at the chosen 1.14 oversize ratio. The +6.8% measured bifacial gain over the SAM monofacial baseline is the difference between the financial model's P50 and the as-built Year-1 production budget. Annual yield of ~2,040 kWh/kWp is consistent with NASA POWER reference data for fixed-tilt utility installations at 33°N latitude.
Default SAM albedo of 0.20 understated Anbar's compacted-desert reality (0.32 measured) by ~12 percentage points of bifacial gain factor. A two-week pyranometer-pair calibration campaign on the substation pad pre-construction moved the lender's P50 yield up by 2.1% — that single line item paid for itself ~340× over the PPA term.
The 132 kV step-up GIS substation has a 14-month order-to-delivery window through standard supply chains. PV blocks can be re-stacked in weeks; the substation cannot. In an IPP schedule with a punitive late-COD penalty, the substation order is committed before the EPC contract is awarded — and the rest of the BoM is sequenced backwards from substation energisation, not forward from notice-to-proceed.
Wet cleaning at this site would have required 18,000 L/day of demineralised water through the dry season — a recurring OpEx exposure to in-country water sourcing and quality. The +1.8% capex premium for one robotic unit per row converts that exposure into a fixed schedule, with telemetry to lender's engineer dashboards. Over 22 PPA years the IRR delta on robotic-vs-wet is ~+0.4 ppt.
Indicative imagery from the TPC delivery library. Site-specific photography is held under the engagement NDA and shared with qualified counterparties on request.
The lender's engineer asked us one question every month for the first year: "is the plant tracking the model?" The answer kept being yes — and then in month nine it was yes plus 6.8%. That's the bifacial gain showing up because we measured the albedo instead of guessing it. The other 22 years of this PPA are a bonus on a base case that already cleared the financial model.Project director · utility-IPP delivery · TPC engineering
Quote is illustrative of the engineering posture TPC brings to utility-scale IPP engagements. This reference profile is not tied to a named or contracted client; site-specific testimonials are released only with the operator's signed consent under the engagement NDA.
Utility-scale IPP, MENA grid-tied PV, or bifacial ground-mount with PPA financing — TPC's engineering team will scope the same equipment envelope for your project under a one-business-day SLA.